
Loading SaaS profile...
Loading SaaS profile...
Analyze business data and automate workflows via plain English.
Translates plain English conversational queries into structured SQL analytics, tables, and charts instantly. Proactively monitors key performance indicators and triggers alerts when metric thresholds shift. Automates recurring business workflows like report generation, lead scoring, and campaign adjustments. Integrates diverse data sources including SQL databases, warehouses, ERPs, and marketing platforms.
Natural language interaction removes traditional technical barriers for non-technical business users. Agentic monitoring catches metric shifts proactively without manual report generation cycles. Pre-built automation templates accelerate deployment across various corporate departments. Flexible integration layers connect seamlessly into existing enterprise tech stacks.
Category: AI & Automation
Team Size: 2-10
Visit Website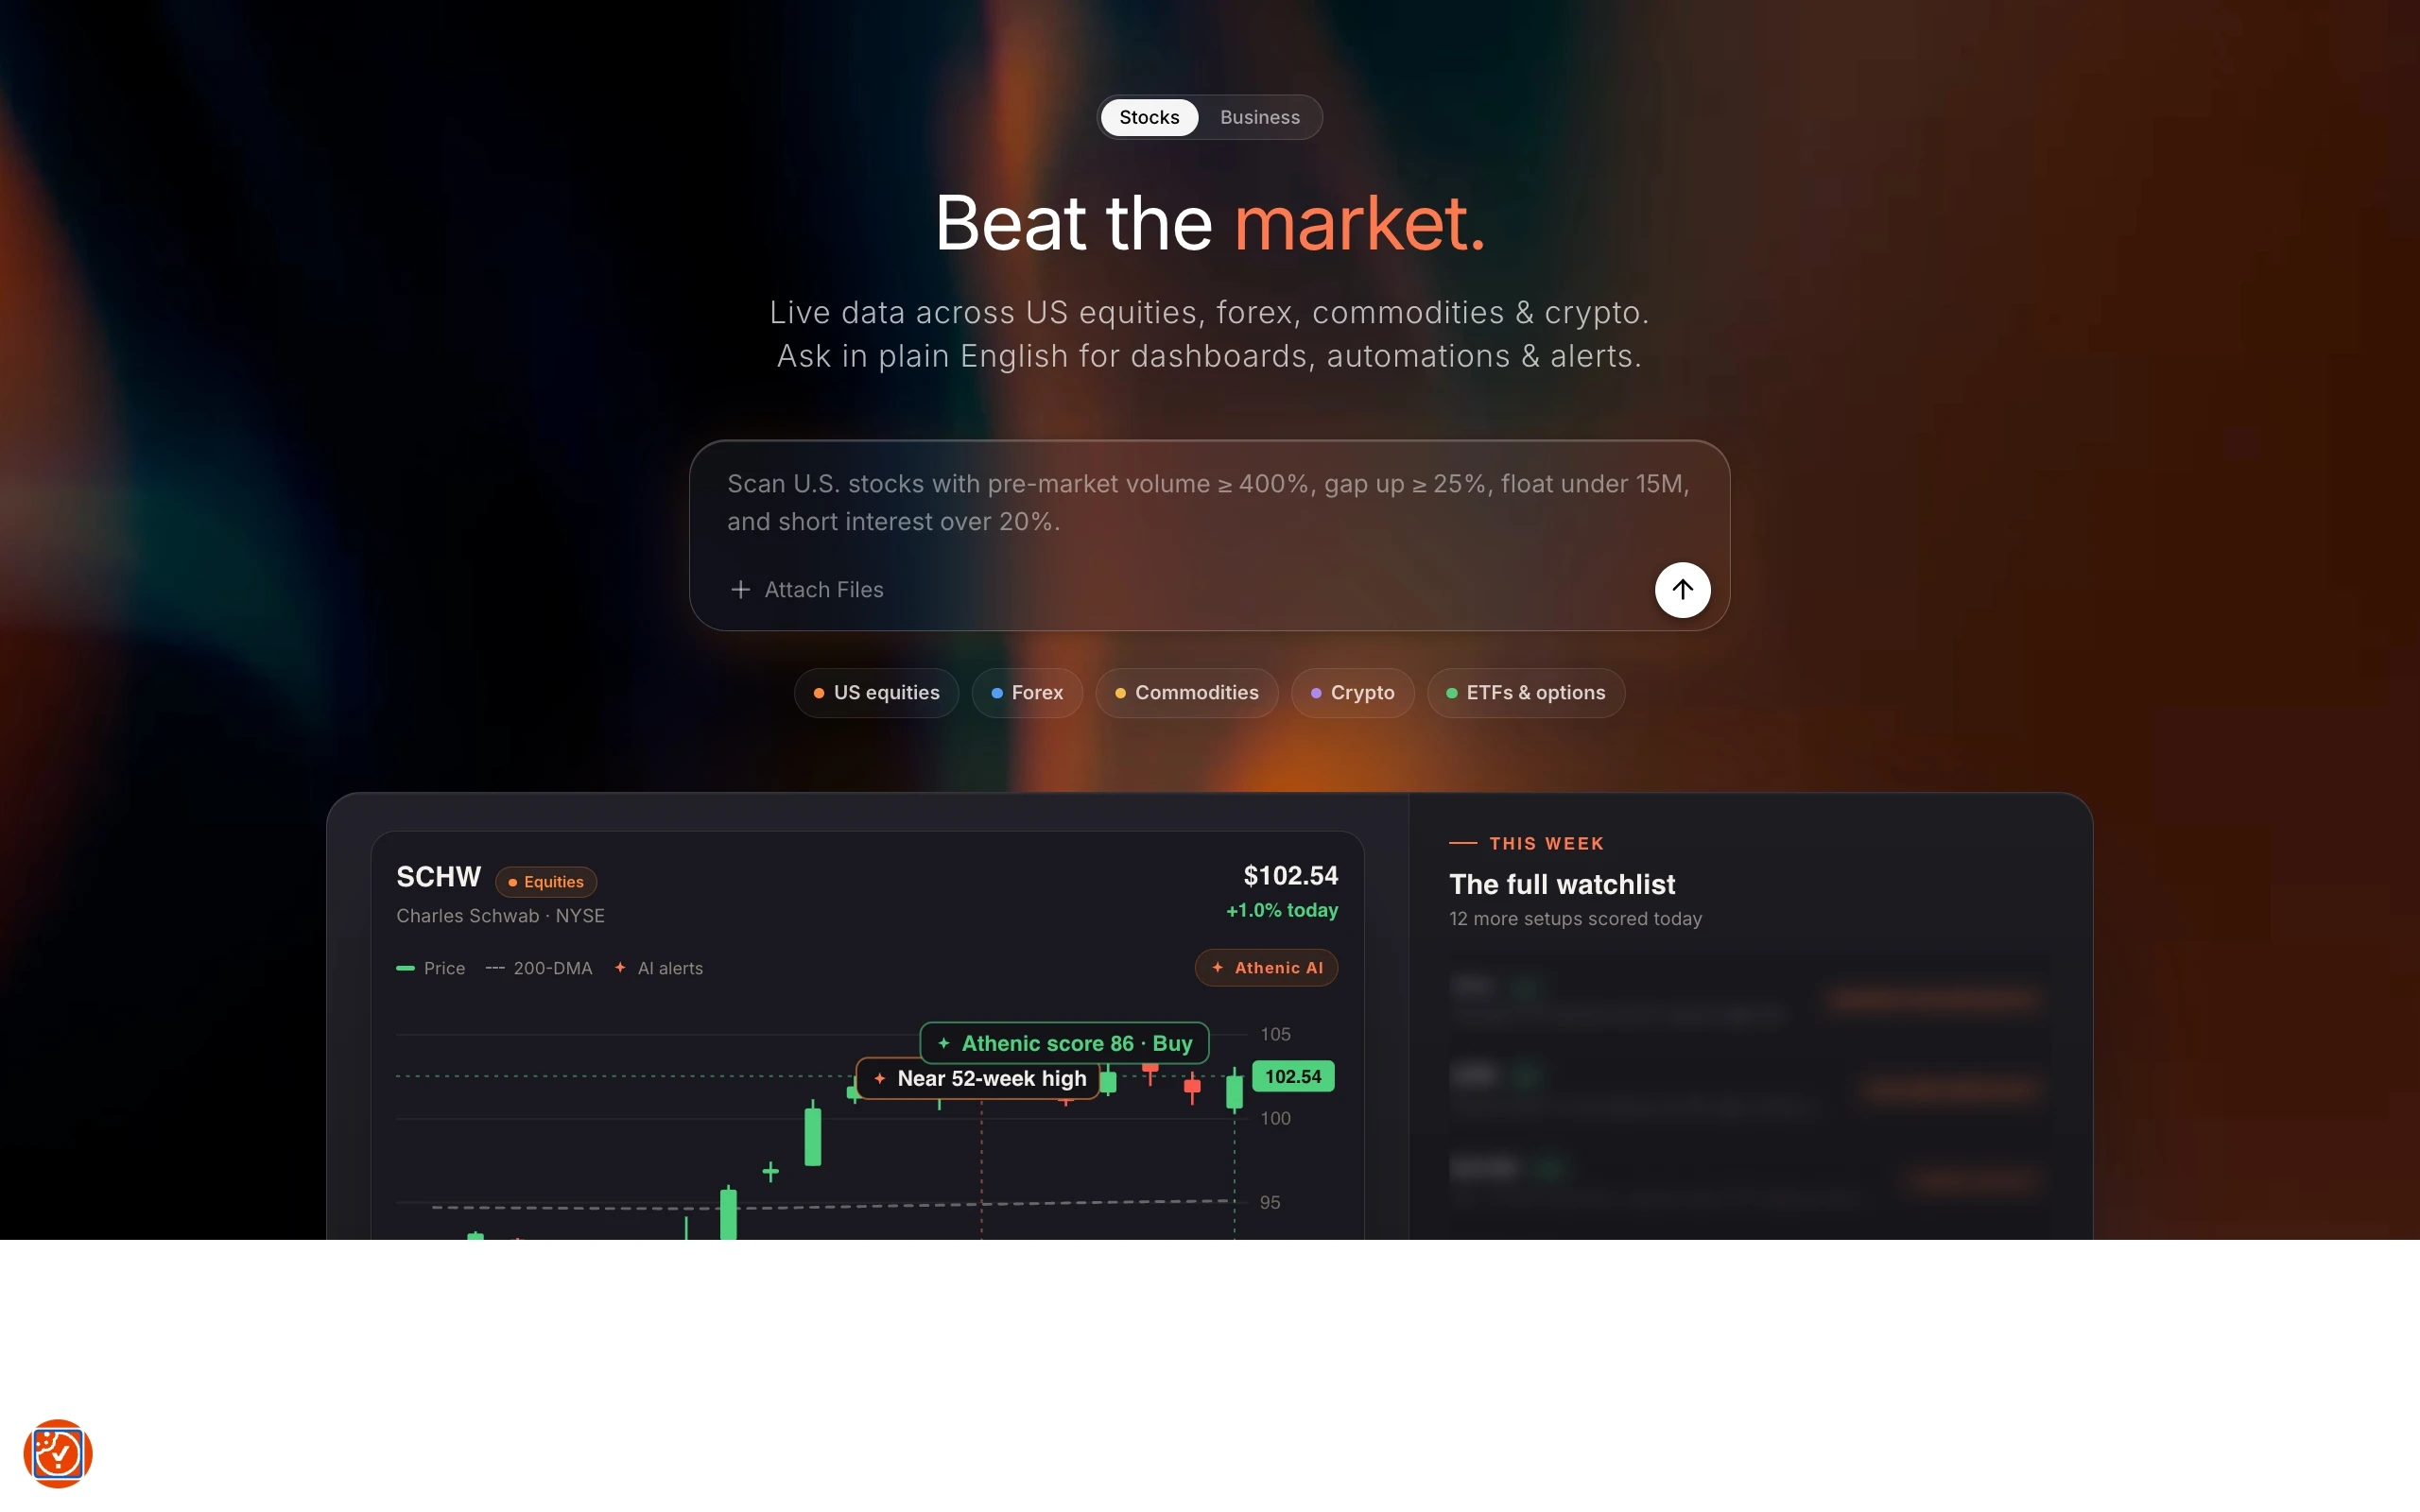
Athenic 2.0 is an advanced AI-powered analytics and automation platform that turns business data queries into instant insights. Users connect their data sources and interact using plain English chat to generate reports, build dashboards, and monitor KPIs. The platform bridges the gap between raw data and decision-making without requiring complex SQL or manual engineering assistance.
Athenic AI was founded in 2023 to streamline business intelligence and eliminate routine reporting bottlenecks. Version 2.0 launched in June 2026, introducing enhanced agentic capabilities to help teams analyze data and automate workflows on autopilot.