
Loading SaaS profile...
Loading SaaS profile...
Unified observability dashboards connecting IT, cloud, and DevOps tools.
• Connects natively with 100+ IT, cloud, and DevOps data sources to aggregate telemetry in real time. • Builds customizable, interactive dashboards with drag-and-drop tiles, status indicators, and drill-down metrics. • Consolidates application health states and system alerts across multi-cloud and hybrid infrastructure environments. • Facilitates secure cross-team collaboration via shareable dashboard links, workspace permissions, and embeddable views.
Plugin-based data mesh architecture queries existing monitoring tools in place without centralizing expensive log storage. Extensive pre-built integrations with Microsoft SCOM, Azure, AWS, and GitHub accelerate dashboard deployment. Free-forever tier lowers adoption friction for small engineering teams testing custom workspace views. Rolled-up health monitors give executive leadership high-level status visibility across complex technical estates.
Category: Utilities & System Tools
Team Size: 26-100
Visit Website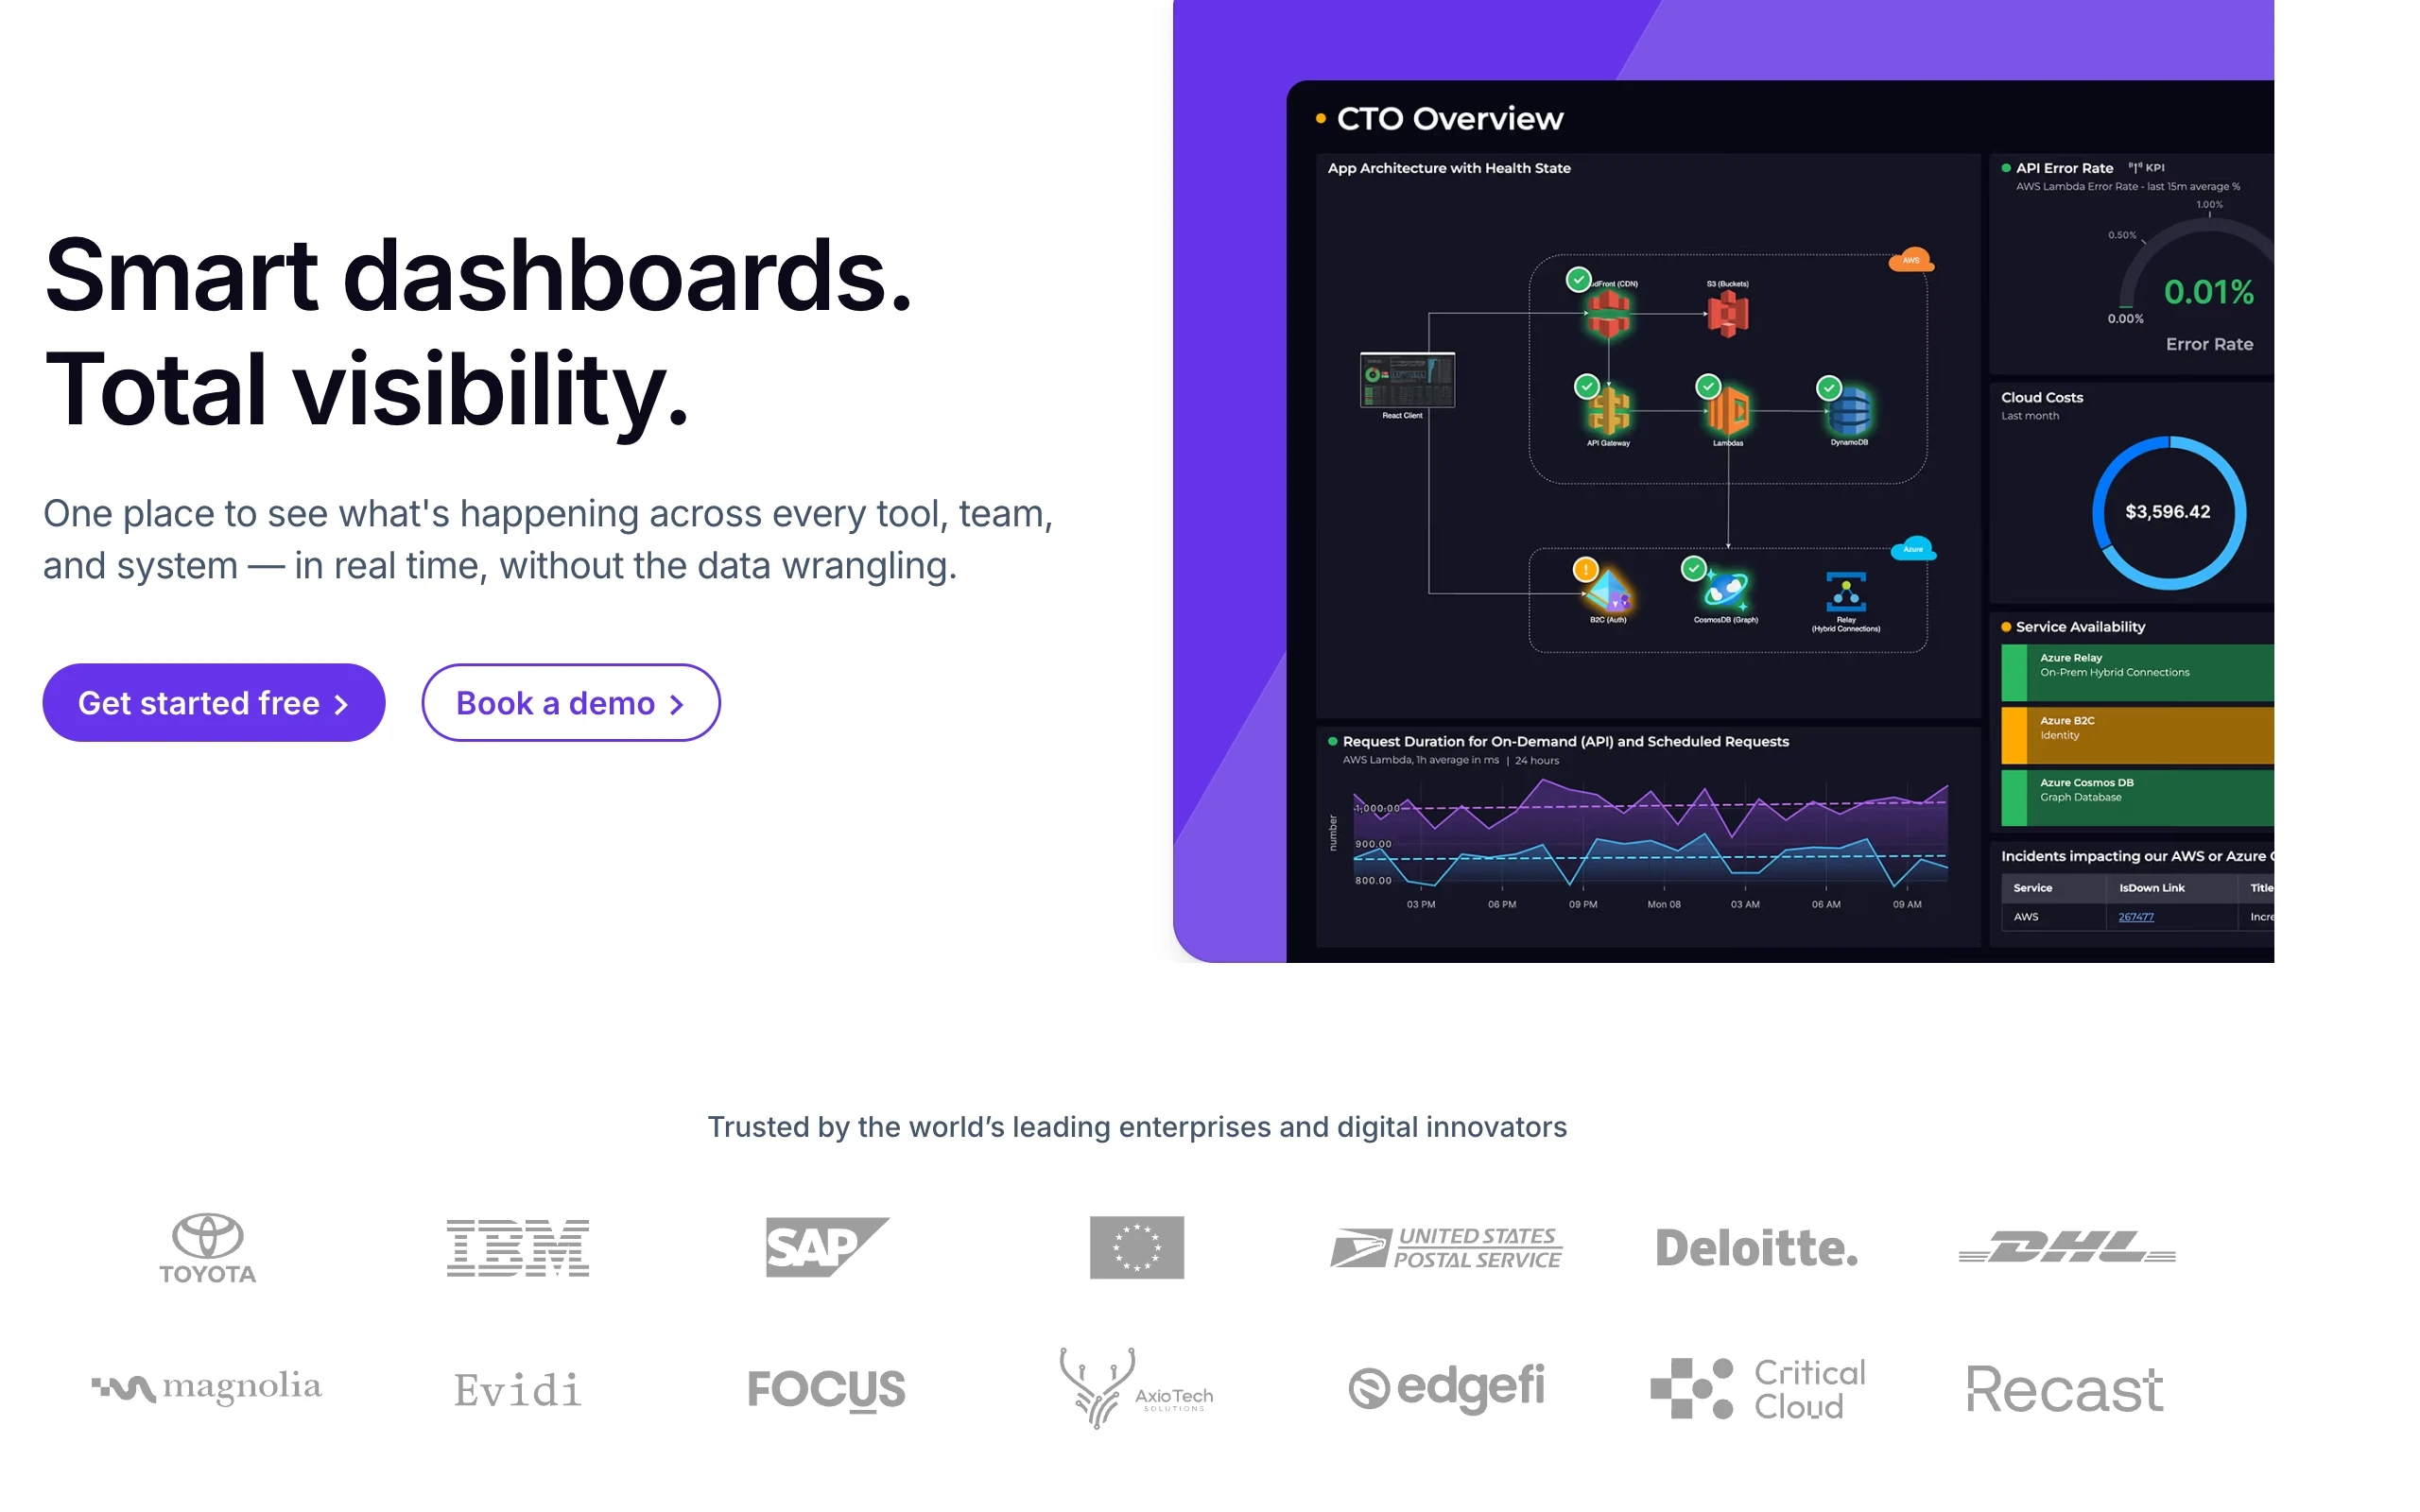
SquaredUp is a data visualization and dashboarding platform built for IT operations, DevOps, and engineering teams. It unifies disparate monitoring data from cloud environments, infrastructure tools, and APM platforms into interactive, real-time dashboards. By indexing and correlating metrics across tools like Microsoft Azure, AWS, SCOM, and Datadog, SquaredUp delivers complete visibility into application health. Organizations use SquaredUp to eliminate data silos, track operational SLIs, and accelerate incident response.
SquaredUp was founded in 2011 in Maidenhead, United Kingdom, by Richard Benwell. Recognizing that enterprise IT teams were drowning in fragmented monitoring data across isolated tools, Benwell created SquaredUp to simplify data visualization. The company grew organically by providing essential dashboarding layers over enterprise systems like Microsoft SCOM before expanding into a multi-cloud observability platform.