
Loading SaaS profile...
Loading SaaS profile...
Cloud KPI dashboard and performance tracking platform.
Creates and monitors customized key performance indicators across various departments and business units. Visualizes complex operational data using interactive charts, graphs, and real-time dashboard widgets. Generates scheduled and ad-hoc performance reports formatted for management review and sharing. Imports and consolidates data seamlessly from multiple spreadsheets and external business databases.
Pricing model features accessible monthly subscription tiers tailored for growing teams and enterprises. Positioned as an intuitive, user-friendly alternative to complex and rigid enterprise business intelligence suites. Technical advantage stems from lightweight cloud deployment and rapid database connectivity requiring minimal setup. Distribution scales effectively through direct online SaaS onboarding and digital marketing channels.
Category: Business & Operations
Team Size: 2-10
Visit Website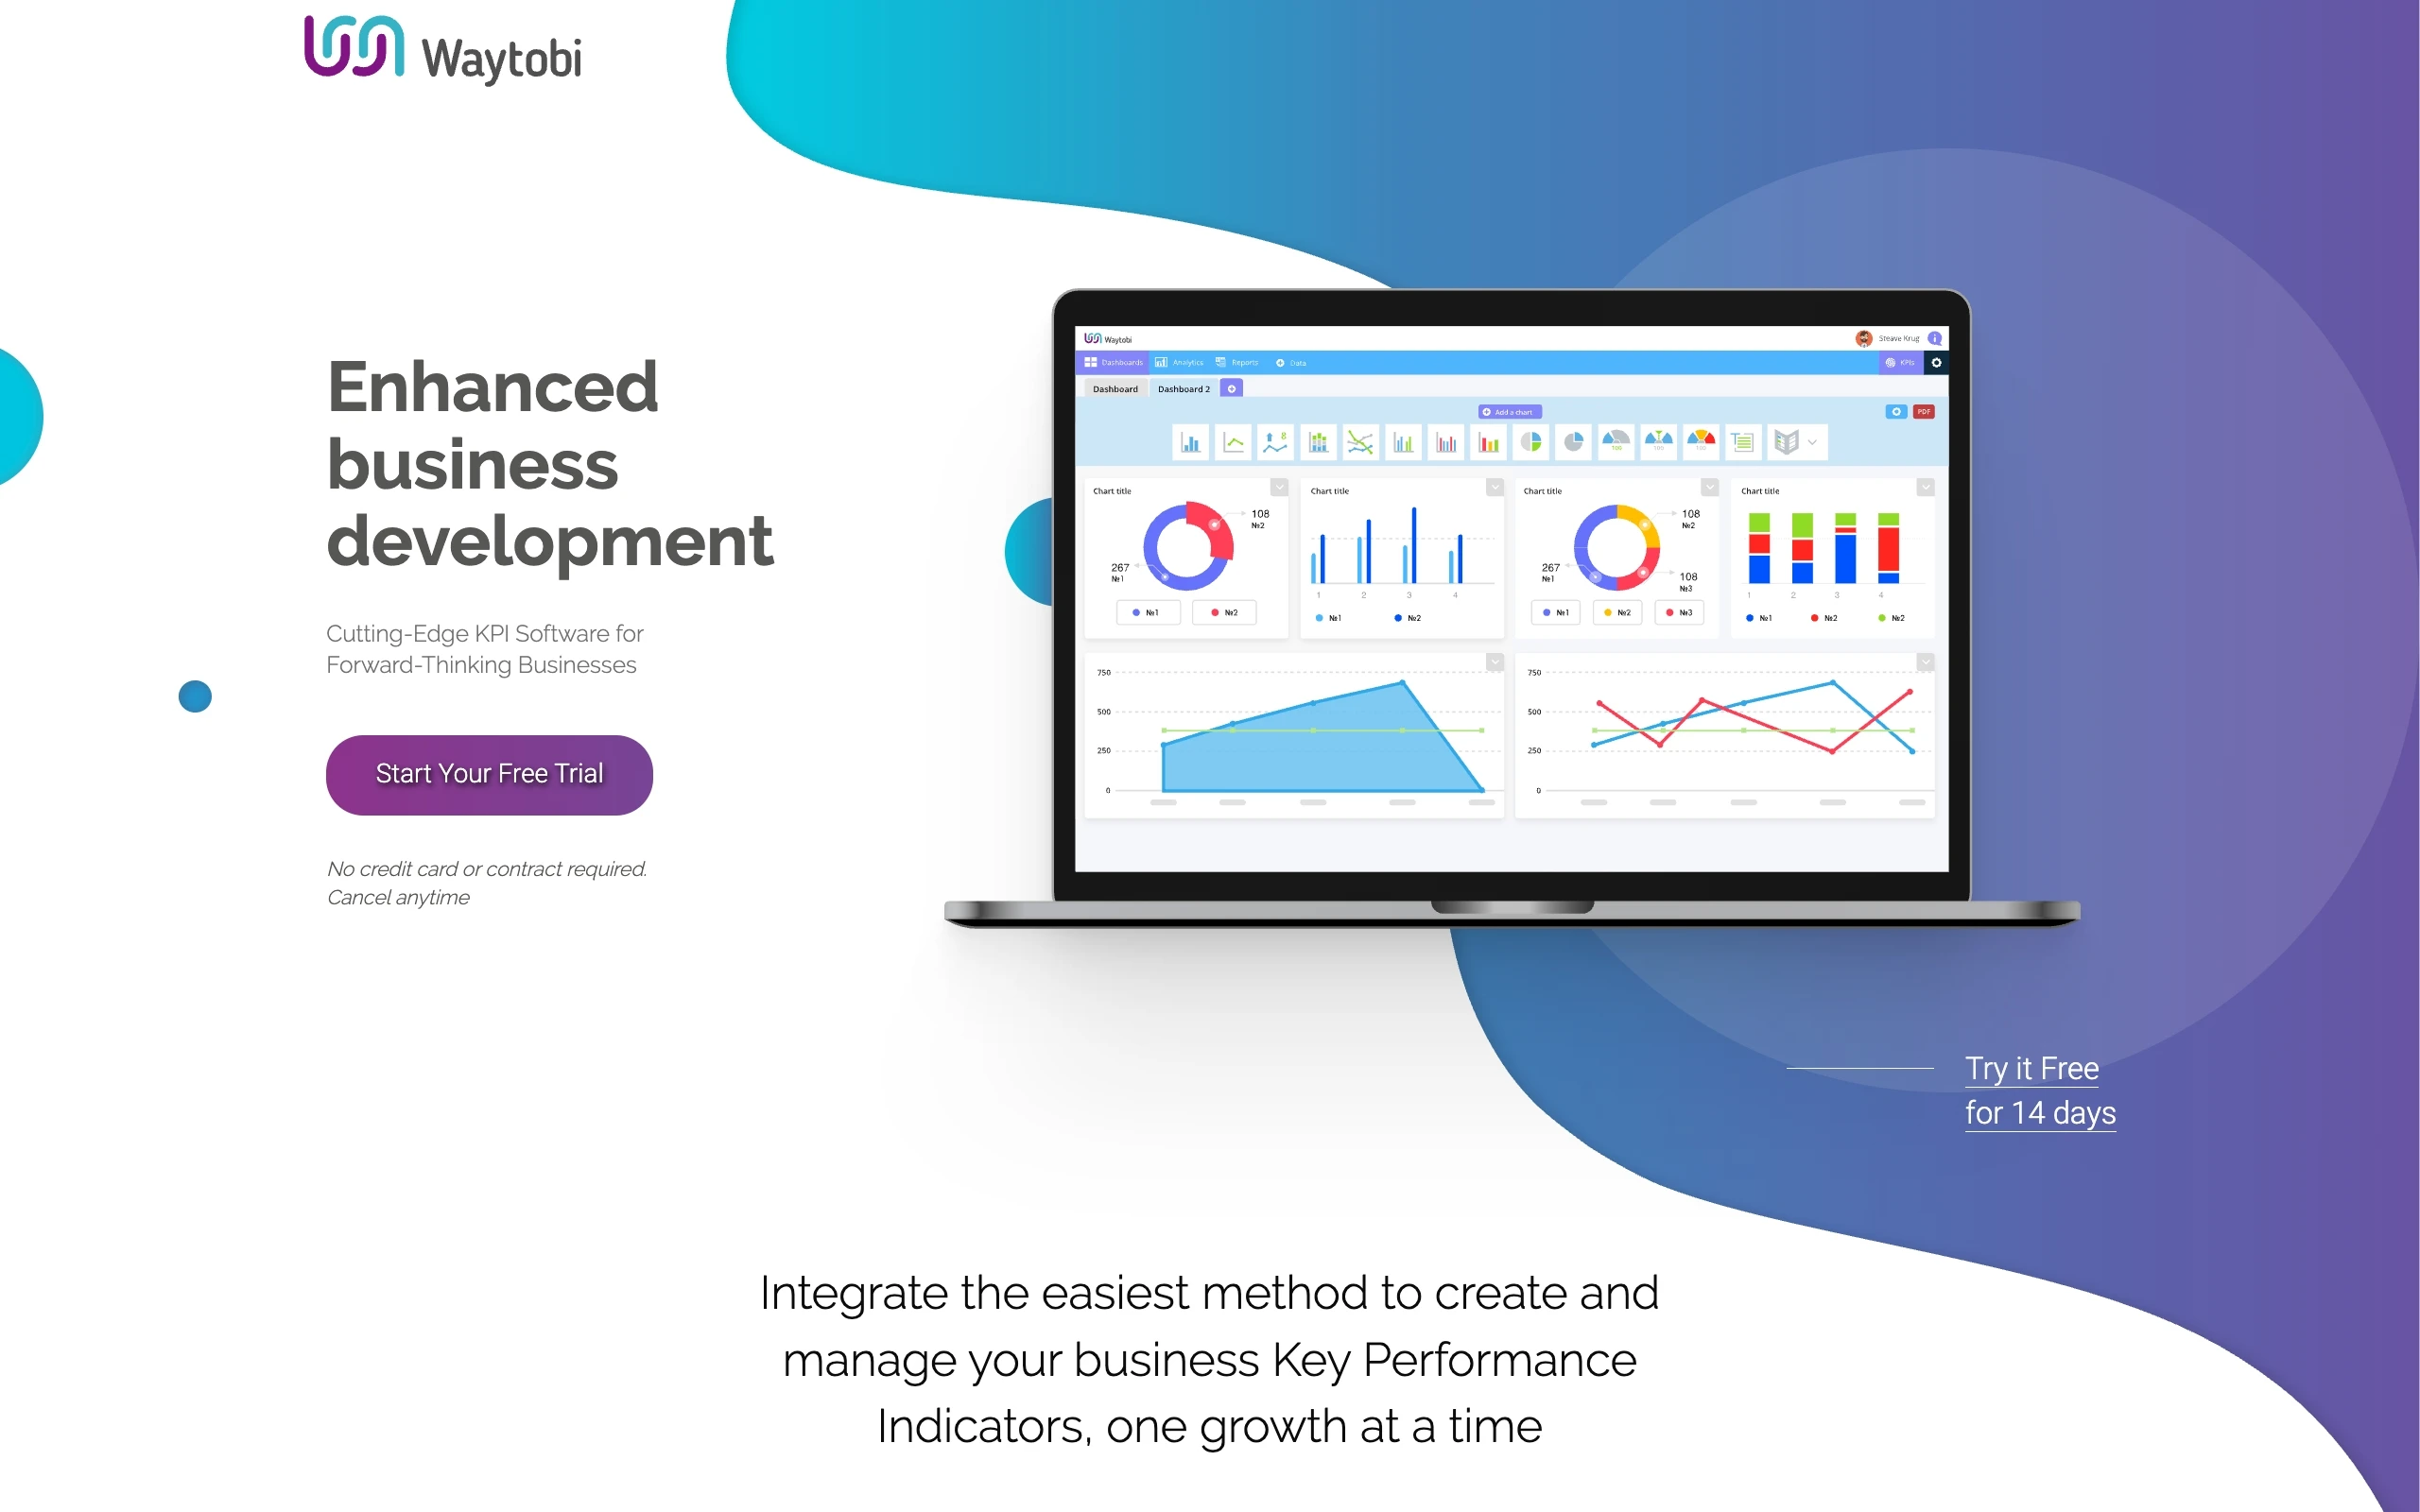
Waytobi is a cloud-based business intelligence and key performance indicator platform designed to help organizations track, analyze, and visualize corporate metrics. The software allows teams to build customized dashboards, monitor department goals, and generate automated performance reports without requiring advanced programming skills. It simplifies data analysis for small businesses and enterprises by unifying disparate operational metrics into a single interface. The platform ensures stakeholders stay aligned with strategic company objectives.
Waytobi was developed to solve complex performance tracking challenges faced by modern organizations. Built by data analytics professionals, the platform focuses on making business intelligence and KPI tracking accessible to non-technical users across diverse industries.