
Loading SaaS profile...
Loading SaaS profile...
A marketing intelligence platform to monitor, visualize, and report multi-source data.
Connects multi-channel marketing data sources automatically to build unified data pipelines. Generates automated, interactive marketing reports and tracking dashboards via a drag-and-drop editor. Features powerful white-label configuration settings to style client reports with personal logos and brand colors. Allows operational teams to monitor aggregate high-level metrics across all enterprise accounts concurrently. Includes curated pre-made reporting templates for popular ad networks and web analytics applications. Utilizes adaptive natural language tools enabling users to ask business queries directly to their analytics data.
Client Retention: Helps agencies scale up visual report updates in minutes, driving high client-facing transparency and clear data accountability. Time Optimization: Drops tedious data cleaning tasks by pulling historical network data natively into preset structures out of the box. Flexible Customization: Eliminates strict engineering prerequisites so anyone can mix different ad performance cross-metrics using clean widgets.
Category: Marketing & Growth
Team Size: 26–100
Visit Website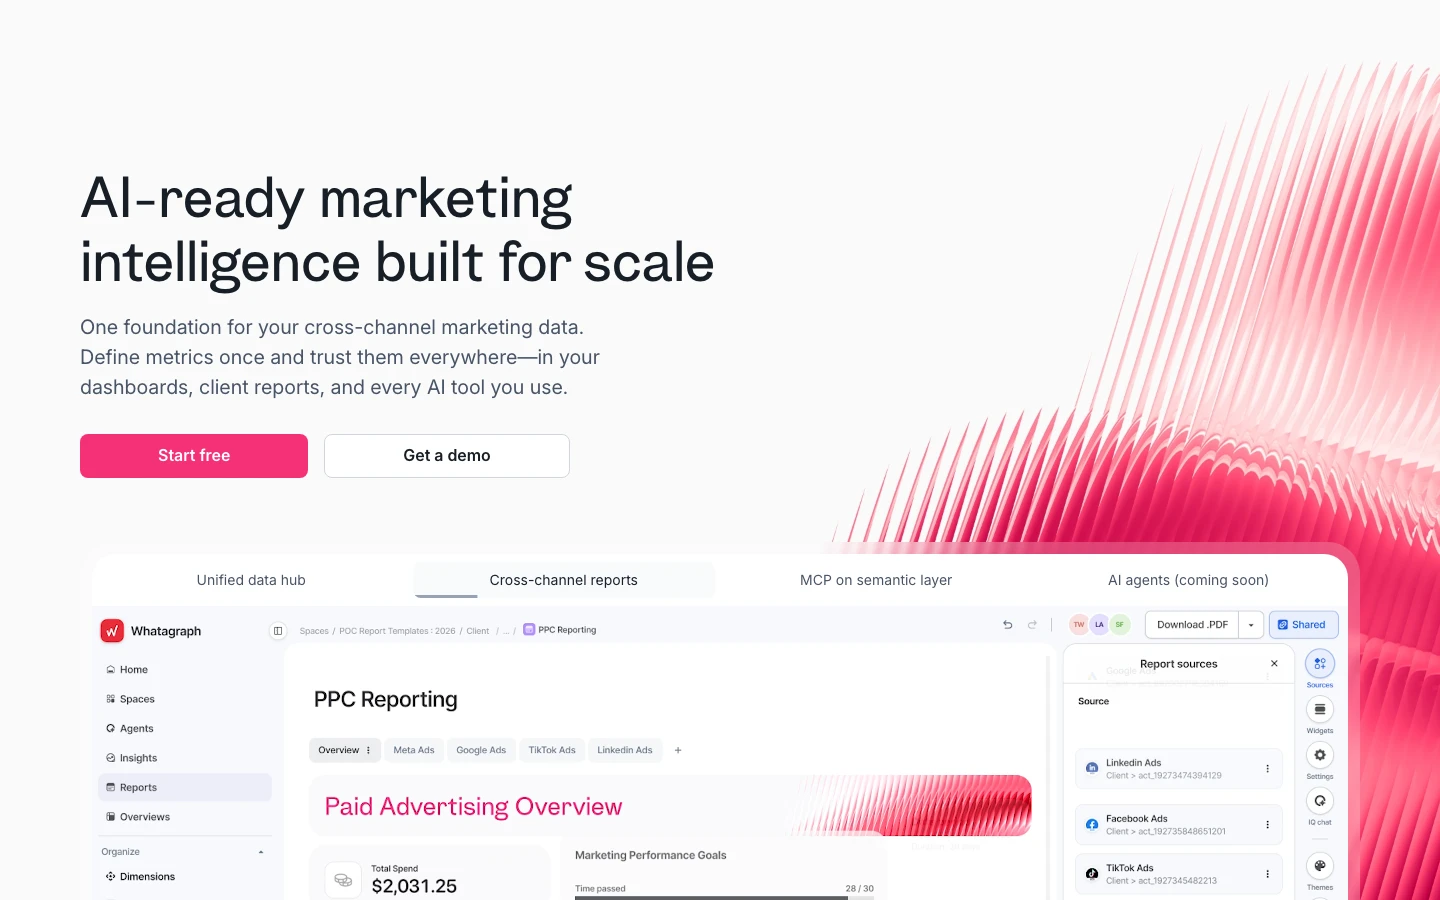
Whatagraph is a robust marketing data and reporting automation platform built for digital marketing agencies, e-commerce brands, and multi-location companies. It replaces manual cross-channel reporting by cleanly connecting, standardizing, and visualizing data from diverse channels—including Google Analytics, Meta Ads, Shopify, and TikTok—into polished dashboards. The platform features an intuitive drag-and-drop widget interface and advanced white-label solutions, allowing client teams to communicate their ROI effortlessly without building complex backend integrations.
Whatagraph was built by brothers Justas, Tomas, and Andrius Malinauskas after experiencing firsthand the immense frustration of manually compiling performance statistics across fragmented marketing tools. Driven to automate administrative operations for modern digital teams, they built an infographic-forward dashboard layer that bridges data source silos directly.